Description
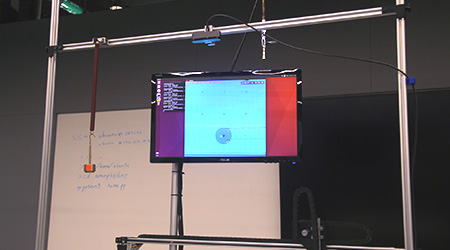
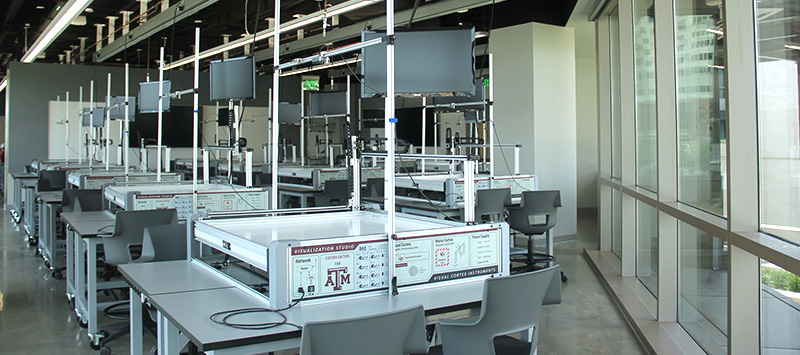
The Visualization Station is the core of the visualization framework for students of engineering and science. This station allows at the core the identification of special markers that can be attached to any object to track the movement of the object in real-time. The visualization stations features:
- Our newer versions contain a state of the art camera, with global shutter and frame-rates up to 160 fps.
- A moving camera-mount pole on the side of unit that effortlessly moves and allows the camera to be position in an array of positions to capture the best angles over the station.
- It features a GPU (graphical processing unit) with an array of CPU cores for heavy duty image processing. Depending on the number of markers and user-processing load the unit is able to identify and track markers from the camera input up to 120 fps.
- A 27″inch curved display screen mounted high above the unit so that all users can see its output. The display can show in real-time the tracking of markers above the air table while also displaying quantitative information on physics quantities and processes such as velocity and acceleration.
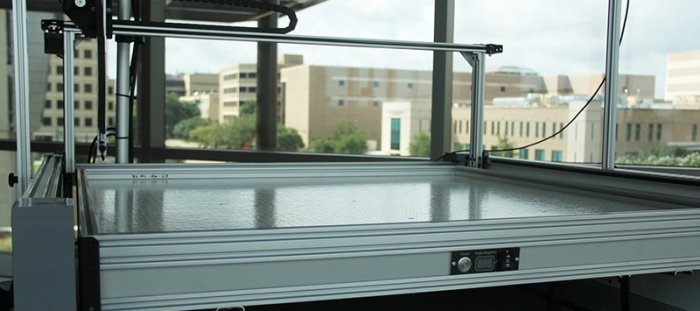
- A CNC-style unit with probe point that can be positioned over any point in a volume of 38in(W)x33in(D)x12in(H).
- A probe point with an communication cable and attachment to hold accessories used for experiments (3D Magnetic Hall probes, Electric Potential probes, etc.)
- An 8-channel Data Aqcuisition unit (DAQ) to collect electric potential information. Furnished with 8 BNC- inputs, 4 channels are used for measuring voltage in a range of +/- 10 V and 4-channels in the range of +/- mV. All inputs are protected +/- 40V.
- Python-based software and an array of basic-examples that allow the user to read and track the markers on the camera, control the movement of the probe and acquire its data, and read each all DAQ channels.


